
Most business owners obsess over customer acquisition while sitting on a goldmine they’ve never properly measured. Your existing customers represent the highest-ROI growth opportunity in your business, yet 73% of companies can’t quantify the financial impact of their customer success efforts. The difference between businesses that scale profitably and those that struggle with unit economics often comes down to one critical skill: measuring customer success ROI.
During my decade at Amazon and Microsoft, I witnessed firsthand how measuring customer success ROI transforms businesses from customer acquisition treadmills into profit-generating machines. Companies that master measuring customer success ROI see 3-5x better returns on their customer success investments compared to those that operate on gut instinct.
In this guide, I’ll walk you through the essential methods for measuring customer success ROI, from calculating Customer Lifetime Value and Net Revenue Retention to tracking expansion revenue and forecasting future returns. We’ll cover the key metrics every business owner should monitor and compare the ROI of outsourcing versus building customer success teams in-house.
Set Clear ROI Objectives
The foundation of any successful customer success program starts with aligning your CS goals directly with revenue targets. I’ve learned from my Amazon and Microsoft days that vague objectives like “improve customer satisfaction” won’t cut it when you’re trying to prove ROI to stakeholders. Instead, you need specific, measurable goals that tie directly to financial outcomes.
Your CS objectives should include specific targets like increasing net revenue retention by 15%, reducing churn by 10%, or growing expansion revenue by 25% within a defined timeframe. When you can show that your customer success initiatives contributed to a 20% increase in annual recurring revenue, suddenly everyone understands the value.
The key is establishing these benchmarks upfront and tracking progress consistently, so you can demonstrate clear before-and-after scenarios that prove your CS team’s impact on the bottom line.
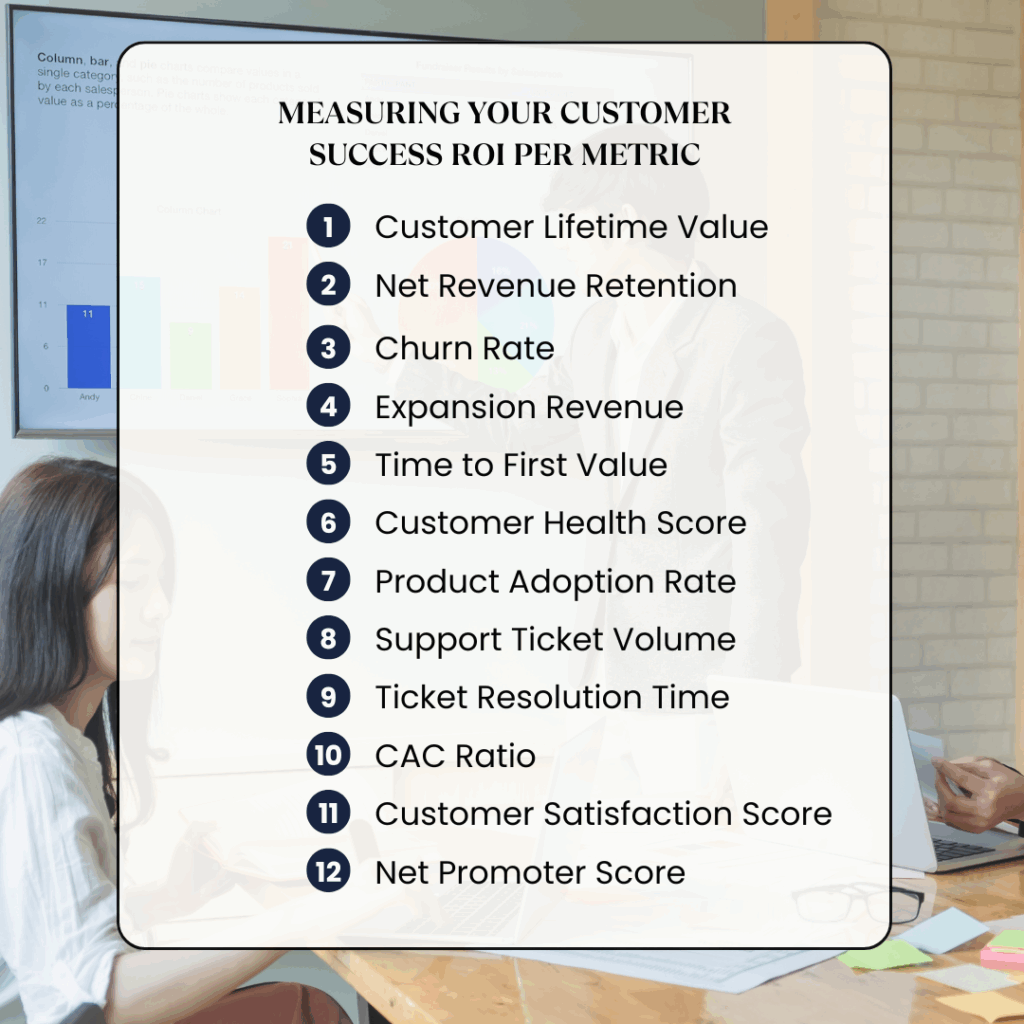
Measuring Your Customer Success ROI Per Metric
Customer Lifetime Value (CLV)
CLV represents the total revenue you expect from a customer over their entire relationship with your company, and it’s arguably the most important metric for proving customer success ROI.
Calculate CLV using this formula: (Average Customer Value × Average Customer Lifespan) × Gross Margin Percentage.
For example, if your average customer pays $500/month for 24 months with a 70% gross margin, your CLV is ($500 × 24) × 0.70 = $8,400. But here’s where most companies miss the mark. Companies usually treat CLV as a static number instead of a dynamic metric that reflects the impact of their customer success efforts.
At Amazon, I learned that every 10% improvement in customer lifespan could increase CLV by 15-25%, directly translating to millions in additional revenue. Track CLV by customer segment and acquisition channel to identify which customers are most valuable and which success strategies drive the highest returns.
When you can show that implementing a new onboarding program increased average CLV from $12,000 to $18,000, you’ve proven a 50% improvement in customer value that directly justifies your CS investment.
Net Revenue Retention (NRR)
NRR measures the percentage of recurring revenue you keep after accounting for upgrades, downgrades, and churn. It’s the ultimate health check for your customer base.
Calculate NRR with this formula: ((Starting MRR + Expansion Revenue – Churned Revenue – Contracted Revenue) ÷ Starting MRR) × 100.
For instance, if you start with $100K MRR, add $20K in expansions, lose $10K to churn, and $5K to downgrades, your NRR is (($100K + $20K – $10K – $5K) ÷ $100K) × 100 = 105%. A healthy NRR typically ranges from 100-130%, but the best companies I work with achieve 140%+ through strategic customer success initiatives.
What makes NRR particularly powerful for ROI demonstration is how it captures the complete financial picture of your customer success efforts. This metric is especially compelling to investors and executives because it shows sustainable growth that doesn’t depend entirely on new customer acquisition. When your NRR improves from 95% to 115% over 18 months, you’re proving that your existing customers are now generating more revenue than when they first signed up.
Churn Rate
Churn rate measures the share of customers who cancel or don’t renew during a given period, but its impact on ROI goes far beyond the obvious revenue loss.
Calculate customer churn rate as: (Number of Customers Lost ÷ Number of Customers at Start of Period) × 100. For revenue churn, use: (MRR Lost to Churn ÷ Starting MRR) × 100.
If you start the month with 1,000 customers and lose 50, your customer churn rate is (50 ÷ 1,000) × 100 = 5%. The real ROI story emerges when you understand that reducing churn has a compounding effect on your business growth and significantly improves your unit economics. In my experience helping businesses optimize their customer success programs, even a 1-2% reduction in monthly churn often results in 6-figure revenue impacts within the first year.
The key is tracking churn by cohort and identifying the specific customer success interventions that drive the biggest improvements. When you can demonstrate that implementing quarterly business reviews reduced churn by 15% while simultaneously identifying $500K in expansion opportunities, you’ve proven multifaceted ROI that extends far beyond simple retention.
Expansion Revenue
Expansion revenue represents additional income generated from upsells, cross-sells, or add-on services, and it’s where customer success truly proves its worth as a profit center rather than just a cost center.
Calculate expansion revenue rate as: (Expansion Revenue from Existing Customers ÷ Total Revenue from Those Customers at Start of Period) × 100.
Also track expansion revenue as a percentage of total revenue: (Total Expansion Revenue ÷ Total Company Revenue) × 100.
The most successful companies I work with generate 60-80% of their growth from existing customers, which is significantly more cost-effective than acquiring new ones.
The ROI can trace new revenue directly back to specific customer success activities. You can create a simple attribution model that tracks expansion revenue by CS activity, whether it’s a quarterly business review, training session, or strategic consultation. I’ve seen businesses increase their expansion revenue by 40-60% simply by implementing systematic tracking that connects CS activities to revenue outcomes.
When your CS team identifies a $50K upsell opportunity during a health score review, and you can attribute that revenue to their proactive intervention, you’ve demonstrated clear ROI that transforms how leadership views customer success investments.
Time to First Value (TTFV)
TTFV measures how long it takes for a customer to realize a meaningful outcome after onboarding, and it’s a leading indicator of both retention and expansion potential. Calculate TTFV by measuring the average number of days from customer signup to when they achieve their first meaningful outcome.
Define “first value” based on your specific product or service—it might be their first successful transaction, campaign launch, or goal achievement.
Track this by calculating: Sum of Days to First Value for All Customers ÷ Number of Customers = Average TTFV.
Optimizing TTFV is remarkable because customers who reach value quickly are 3-5 times more likely to remain long-term customers and generate expansion revenue. Track TTFV by customer segment and continuously optimize your onboarding process. When you can show that shortening TTFV from 30 days to 20 days resulted in a 20% improvement in 90-day retention rates, you’ve demonstrated clear ROI that justifies investment in better onboarding systems and processes.
Customer Health Score
A customer health score is a composite metric that flags engagement levels, risk factors, and renewal likelihood by combining multiple data points into a single, actionable number.
Calculate health score by assigning weights to different factors: Health Score = (Product Usage Score × 30%) + (Engagement Score × 25%) + (Support Experience Score × 20%) + (Payment History Score × 15%) + (Relationship Quality Score × 10%).
Each component should be scored on a consistent scale (typically 1-10 or 1-100), and weights should be based on their correlation with actual churn and expansion behaviors.
When health scores identify expansion-ready customers, you can proactively pursue upsell opportunities. The key is ensuring your health score triggers specific workflows and interventions to track the revenue saved through at-risk interventions and the expansion revenue generated through healthy customer identification to demonstrate clear ROI.
Product Adoption Rate
Product adoption rate measures the percentage of your user base actively using core features or modules, and it serves as a bridge between customer success efforts and revenue outcomes.
Calculate adoption rate as: (Number of Users Who Adopted Feature ÷ Total Number of Users) × 100.
For depth of adoption, calculate: (Number of Users Using Multiple Features ÷ Total Number of Users) × 100.
Track both breadth (how many features) and depth (how extensively they use each feature) to get a complete picture of product adoption.
From my experience, customers who adopt multiple features or use cases are typically 2-3 times more valuable than single-feature users. Create adoption milestones that correlate with revenue outcomes and design CS programs that drive customers toward those milestones. When you can show that customers who participate in your training programs achieve 40% higher adoption rates and subsequently generate 25% more expansion revenue, you’ve proven a clear connection between CS activities and financial outcomes.
Support Ticket Volume
Support ticket volume represents the count of support requests submitted, serving as an indicator of friction points in your product or processes.
Calculate ticket volume rate as: Total Number of Tickets ÷ Total Number of Customers = Tickets per Customer.
Also track tickets per customer segment and tickets per product feature to identify specific problem areas.
Monitor trends by calculating: (Current Period Tickets – Previous Period Tickets) ÷ Previous Period Tickets × 100 = Percentage Change in Ticket Volume.
The ROI impact is twofold: reduced operational costs and improved customer satisfaction leading to higher retention. When I help businesses optimize their support processes, we typically see 20-30% reductions in support costs while simultaneously improving customer satisfaction scores.
Calculate the cost savings by multiplying the reduction in ticket volume by your average cost per ticket. Track the proactive impact of CS initiatives on support volume when better onboarding reduces support tickets by 25%, you’ve demonstrated clear cost savings and improved customer experience. Additionally, measure the relationship between support metrics and retention rates, as customers who have positive support experiences are significantly more likely to renew and expand.
Ticket Resolution Time
Ticket resolution time measures the average duration between ticket creation and final resolution, and it’s a critical component of overall customer experience that directly impacts retention and expansion potential.
Calculate average resolution time as: Sum of All Resolution Times ÷ Number of Resolved Tickets = Average Resolution Time.
Also calculate First Response Time: Sum of All First Response Times ÷ Number of Tickets = Average First Response Time.
Studies show that customers who experience fast, effective support resolution are 2-3 times more likely to expand their relationship with your company. Calculate the impact by tracking retention rates for customers with different resolution time experiences. The key is connecting resolution time improvements to downstream revenue impacts through retention analysis and customer satisfaction tracking.
Customer Acquisition Cost (CAC) Ratio
The CAC ratio compares what you spend to acquire a customer versus the revenue they generate, providing crucial insight into resource allocation efficiency between acquisition and retention efforts.
Calculate CAC as: Total Acquisition Costs ÷ Number of New Customers Acquired = CAC per Customer. Then calculate the CAC to CS Investment Ratio: Total CAC ÷ Total Customer Success Investment = CAC Ratio.
Track how changes in this ratio impact your overall unit economics and the CAC Payback Period: CAC ÷ Average Monthly Revenue per Customer = Months to Payback.
Understanding your CAC ratio helps optimize resource allocation for maximum ROI impact. What I’ve learned from scaling CS programs at Amazon and Microsoft is that companies often under-invest in customer success relative to acquisition, missing significant ROI opportunities.
The optimal ratio varies by industry, but I typically recommend a 3:1 or 4:1 ratio of acquisition to success investment for most B2B companies. Track how changes in this ratio impact your overall unit economics and revenue growth to find the optimal balance that maximizes total return on investment.
Customer Satisfaction Score (CSAT)
CSAT measures the average post-interaction rating that reflects how happy customers are with your service, typically collected through surveys after support interactions, onboarding, or major milestones.
Calculate CSAT as: (Number of Positive Responses ÷ Total Number of Responses) × 100.
For numerical scales, calculate: Sum of All Ratings ÷ Number of Responses = Average CSAT Score.
Research consistently shows that customers with high satisfaction scores have 2-3 times higher lifetime values and generate 40-50% more referrals. Calculate the revenue impact by tracking retention rates and expansion revenue for customers with different CSAT scores. The key is connecting satisfaction improvements to specific revenue outcomes through cohort analysis and tracking the relationship between CSAT scores and customer behavior over time.
Net Promoter Score (NPS)
NPS gauges how likely your customers are to recommend your product to others, serving as both a loyalty metric and a predictor of organic growth potential.
Calculate NPS as: % of Promoters (scores 9-10) – % of Detractors (scores 0-6) = NPS. Passives (scores 7-8) are not included in the calculation.
For example, if 60% are promoters, 20% are passives, and 20% are detractors, your NPS is 60% – 20% = 40. NPS scores range from -100 to +100, with scores above 50 considered excellent.
The ROI impact of NPS improvement is multifaceted, affecting both retention and acquisition costs through increased referral rates. At Amazon, we discovered that promoters had 3-5 times higher lifetime values than detractors and generated 2-3 times more referrals.
Calculate the referral revenue impact by tracking: (Number of Referrals from Promoters × Average Customer Value) – (Referral Acquisition Costs) = Net Referral Revenue.
When you can show that improving NPS from 20 to 40 resulted in a 50% increase in referral revenue and 20% improvement in retention rates, you’ve demonstrated powerful ROI. Track NPS by customer segment and identify the specific customer success activities that drive the biggest improvements.
outsourcing ROI comparisons
Conclusion: Charting Your Next Moves
The impact of measuring customer success ROI is immediate and measurable. It’s what separates profitable businesses from those that struggle to justify their growth investments. ROI-focused business owners who implement systematic customer success measurement see their numbers transform quickly. When you can demonstrate that every dollar invested in customer success generates $3-5 in additional customer lifetime value, measuring customer success ROI becomes your most powerful tool for sustainable profit growth.
My experience scaling customer success operations at Amazon and Microsoft taught me that measuring customer success ROI is about connecting every activity to bottom-line results. The business owners who succeed don’t just track vanity metrics. They build measurement frameworks that directly tie customer success activities to revenue outcomes.
When ROI-focused business owners implement these measurement frameworks, they typically see meaningful improvements within 90 days and transformational profit impacts within 12 months.
GetCSM provides ROI-focused business owners with the expertise and proven systems to accelerate customer success ROI. We eliminate the 12-18 month learning curve of building internal capabilities from scratch. We’ve helped companies increase their customer success ROI by 200-400% through systematic measurement and optimization processes.
Our clients achieve these results because we bring established frameworks, experienced teams, and proven methodologies that deliver immediate impact. The question isn’t whether measuring customer success ROI will impact your profits—it’s whether you’ll capture that impact through proven expertise or attempt to build it from scratch while your competitors gain the advantage.
Schedule your consultation here and start turning your customer success efforts into your most profitable growth engine.