Every dollar you invest in customer success should come back multiplied and that’s exactly what customer success metrics for revenue help you achieve. These are the data points that tell you which accounts need extra love, which features spark upsells, and where friction is costing you cash. When you track the right metrics you move from guesswork to laser-focused growth plays.
In this guide you’ll discover the top 12 customer success metrics for revenue, from Health Score and Net Promoter Score to Time to Value and Upsell Revenue. You’ll learn why each metric matters, see real-world benchmarks and get practical tips for turning insights into action.
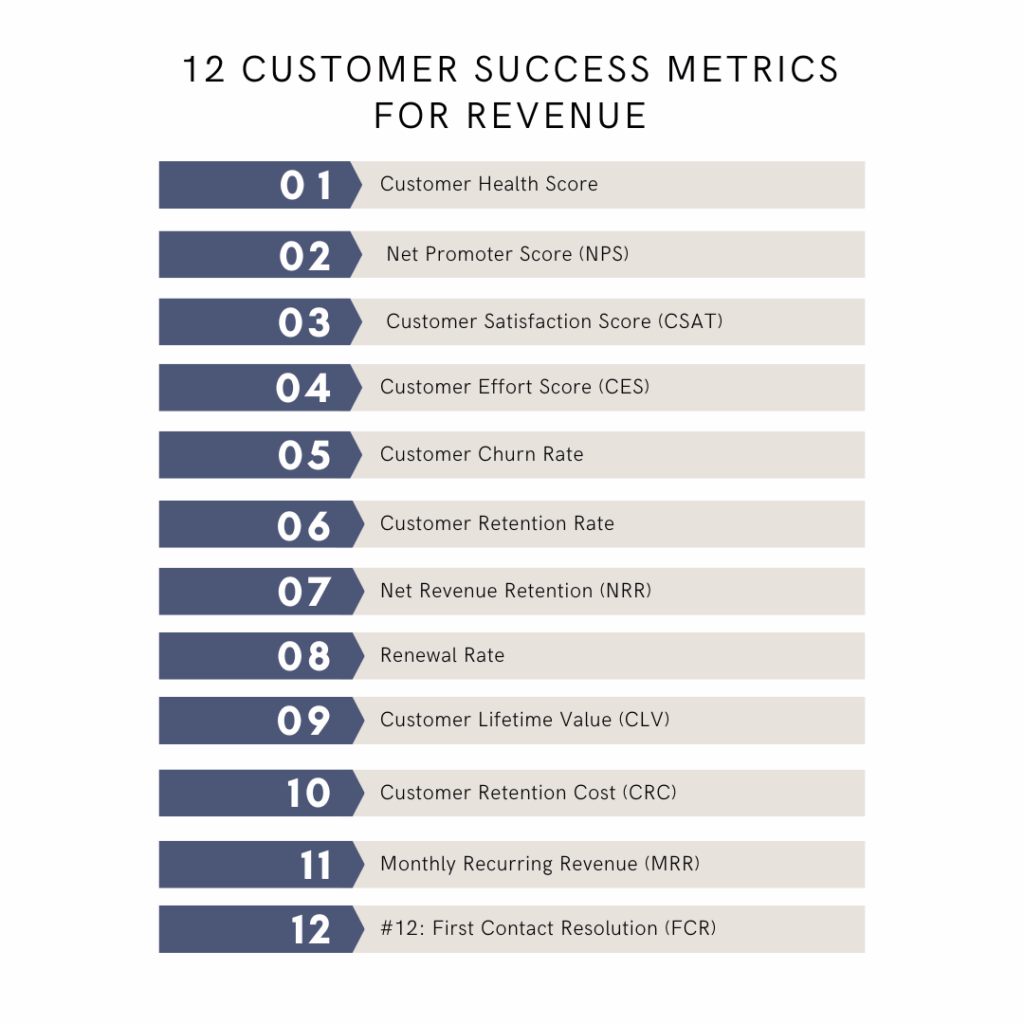
12 Customer Success Metrics For Revenue
Customer Success Metrics For Revenue #1: Customer Health Score
A Customer health score measures revenue impact by combining product usage, support interactions, billing punctuality and survey sentiment into one composite number that flags both churn risk and expansion potential. Companies with Health Scores above 80 have renewal rates of 92% compared to 48% for scores under 50.
In my experience I find that customizing the weight of each indicator based on your business model (for example assigning extra weight to feature adoption in a product-led model and more weight to payment timeliness in a subscription service) lets you trigger proactive engagement well before small issues become lost accounts.
By tracking Health Scores continuously you gain a clear view of which customers need immediate attention and which are ripe for upsell. This helps you optimize resource allocation, prevent revenue leakage and build a more predictable growth engine.
Customer Success Metrics For Revenue #2: Net Promoter Score (NPS)
NPS measures revenue impact by predicting customer advocacy and referral potential through a single question “On a scale of 0 to 10 how likely are you to recommend us?” Businesses maintaining an NPS above 50 grow revenues 2.5 times faster than their industry peers. Classifying respondents into promoters (9–10), passives (7–8) and detractors (0–6) lets you prioritize referral programs and remediate detractors before negative word-of-mouth spreads.
Referrals often cost up to 80% less than paid acquisition and tend to deliver higher lifetime value. Keeping a close eye on NPS trends gives you real-time insight into shifts in loyalty, product-market fit and customer sentiment so you can shore up weak spots and double down on what is already resonating.
Customer Success Metrics For Revenue #3: Customer Satisfaction Score (CSAT)
CSAT ties customer happiness directly to revenue by quantifying satisfaction at key touchpoints such as onboarding, feature rollouts or support resolution with a “How satisfied are you with our service today?” survey. A 5% lift in CSAT correlates with a 7% increase in repeat-purchase revenue. I recommend capturing CSAT at multiple stages of the journey and closing the feedback loop within 24 hours on any score below your benchmark to show customers you listen and build deep trust.
High CSAT not only reduces churn and lowers support costs but also fuels word-of-mouth advocacy. Embedding CSAT into your regular operations fosters a culture of continuous improvement that leads to smoother renewals and a healthier bottom line.
Customer Success Metrics For Revenue #4: Customer Effort Score (CES)
CES measures revenue impact by asking customers “How easy was it to get your issue resolved?” since lower-effort experiences drive loyalty. 94% of customers who report very low effort remain loyal compared to only 4% when effort is high, showing that reducing friction directly guards revenue. By identifying bottlenecks in self-service portals, handoffs or wait times you can streamline journeys and keep customers engaged.
Reducing customer effort is one of the fastest ways to boost retention and satisfaction. Simplify every interaction with intuitive self-service tools, AI-driven knowledge bases and clear escalation paths so your team spends more time strengthening relationships and less time firefighting.
Customer Success Metrics For Revenue #5: Customer Churn Rate
Churn rate measures the percentage of customers lost over a given period and directly reveals revenue leakage. Subscription businesses that reduce churn by 1% can see profit increases of up to 8%, underscoring churn reduction as a high-leverage growth lever. When I work with teams I recommend cohort-based churn analysis (breaking down churn by plan type, tenure and usage patterns) so you know exactly where to deploy targeted retention plays.
For business owners churn is a stealth drain on growth because every lost account erodes your recurring revenue base and ups acquisition pressure. A proactive churn-reduction program featuring reactivation campaigns, loyalty incentives and customized training preserves hard-won revenue and builds a stable foundation for expansion.
Customer Success Metrics For Revenue #6: Customer Retention Rate
Retention rate measures the percentage of customers who remain active over a set period, serving as a direct indicator of recurring revenue stability. Increasing retention by 5% can boost profitability by 25% to 95%, making it one of the most powerful drivers of margin improvement. By tracking retention monthly and annually you can spot dips after product updates or pricing changes and launch timely interventions.
High retention reduces reliance on costly new-customer acquisition and validates your ongoing value proposition. Business owners who focus on retention free up a budget for innovation or new markets while maintaining the financial runway to pursue strategic growth initiatives.
Customer Success Metrics For Revenue #7: Net Revenue Retention (NRR)
NRR measures revenue expansion and contraction within your existing base by accounting for upsells, cross-sells, downgrades and churn. Leading SaaS companies average NRR of 110% to 120%, meaning expansion revenue more than covers attrition and fuels net growth. In my experience mapping NRR by customer segment uncovers high-opportunity cohorts where targeted success plays can maximize account expansion.
An NRR over 100% signals that your expansion motion outpaces churn, creating a virtuous cycle of growth. By dissecting NRR components, founders can focus on the most lucrative upsell strategies and automate lower-touch segments for greater efficiency and profitability.
Customer Success Metrics For Revenue #8: Renewal Rate
Renewal rate tracks the percentage of contracts or subscriptions renewed at term end, underpinning predictable subscription cash flow. Companies with renewal rates of 90% or higher enjoy 40% lower cost of capital and steadier growth trajectories. By analyzing renewal trends against usage data, support satisfaction and engagement touchpoints you can anticipate at-risk accounts and deploy retention tactics well before renewals come due.
Mastering renewals locks in future revenue and reduces volatility from new-logo dependency. Proactive engagement, value reinforcement and timely negotiations turn potential churn events into renewal wins that strengthen both customer relationships and company valuation.
Customer Success Metrics For Revenue #9: Customer Lifetime Value (CLV)
CLV quantifies the total revenue an average customer contributes over their entire relationship, guiding how much you can afford to spend on acquisition and retention. The average B2B SaaS CLV is about $13,000 while market leaders exceed $25,000. I calculate CLV at both product-line and segment levels to identify high-value cohorts and tailor marketing, sales and success strategies accordingly.
Understanding CLV empowers founders to set acquisition budgets that guarantee profitability and to focus product roadmaps on features that drive long-term engagement. Targeting high-CLV segments with personalized offers and proactive success plans secures healthier returns on marketing spend and builds a more resilient revenue base.
Customer Success Metrics For Revenue #10: Customer Retention Cost (CRC)
CRC measures the total investment required to keep customers engaged including success staffing, support tools and loyalty programs to ensure you do not overspend on retention. The average CRC is about $130 per customer, with top teams driving it below $100. Pairing CRC with CLV helps you maintain a healthy spend-to-value ratio and reinvest savings in the initiatives that deliver the highest return.
Tracking CRC lets you optimize success operations and validate the ROI of your retention efforts. Entrepreneurs who manage CRC effectively strike the right balance between service quality and cost efficiency while nurturing the relationships that underpin sustainable recurring revenue.
Customer Success Metrics For Revenue #11: Monthly Recurring Revenue (MRR)
MRR aggregates predictable income from all active subscriptions in a given month, serving as your growth barometer. Companies growing MRR by 10% month over month typically double their ARR in under eight months. In my work I advise breaking MRR into new, expansion, contraction and churn components so you can diagnose which motions drive the most meaningful growth.
Analyzing MRR by component allows founders to fine-tune pricing, packaging and engagement strategies to accelerate the right segments. A balanced MRR profile ensures stable cash flow while highlighting opportunities to optimize customer acquisition and expansion for maximum impact.
Customer Success Metrics For Revenue #12: First Contact Resolution (FCR)
FCR measures the percentage of support issues resolved on the first interaction and directly cuts support costs while boosting satisfaction. Teams with FCR rates above 70% see churn reductions of up to 14% compared to teams below 50%. Empowering agents with AI-driven knowledge bases and clear escalation paths is key to first-touch success.
High FCR not only reduces operational overhead but also reinforces customer confidence in your brand. Rapid issue resolution elevates perceived value, strengthens loyalty and contributes to smoother renewals and positive word-of-mouth that fuels new business.
What Makes a Customer Success Metric Truly Revenue-Driving?
A customer success metric truly drives revenue by clarifying the direct impact of customer actions on financial outcomes such as increased retention, expansion or reduced support costs. For example, companies that cut churn by 1% experience up to an 8% boost in profit. When a metric is tied to a specific dollar outcome it becomes a lever for growth rather than a vanity number.
Such metrics must be actionable, offering clear thresholds that trigger targeted playbooks before small issues escalate into lost accounts. They also work best as leading indicators so you can intervene early and convert minor improvements into significant financial gains.
In my work at getCSM I teach clients that the most powerful metrics meet two criteria: a strong correlation to revenue and a predefined action plan. I help teams map every metric to a dollar impact like linking a five point drop in Health Score to a forecast loss of 10% of ARR and immediately launching an executive business review. By tying each metric to real financial outcomes and codifying the exact next steps, companies move from reactive reporting to proactive revenue-driving execution.
What Are the Best Tools to Track Customer Success Metrics?
The best tools to track customer success metrics are:
- Gainsight – Gainsight offers a comprehensive customer success platform with dashboards for health scoring, churn risk, NPS, CSAT and expansion revenue. It integrates CRM, product usage and survey data to power automated alerts when key metrics fall below defined thresholds.
- ChurnZero – This tool provides real-time health scores, segmentation and in-app engagement tools that help you identify at-risk customers and drive adoption. It tracks usage patterns, support tickets and survey responses to trigger tailored playbooks.
- Totango – Totango uses its SuccessBLOC framework to organize metrics by lifecycle stage like onboarding, adoption, renewal and expansion. You get preconfigured dashboards for MRR, NRR, renewal rates and feature adoption plus easy customization.
- HubSpot Service Hub – HubSpot Service Hub embeds CSAT, NPS and CES surveys directly into your support workflows and links those scores to deals and revenue in your CRM. Built-in reporting reveals how support performance correlates with retention and expansion.
- Zendesk – Zendesk’s analytics suite tracks first contact resolution, time to resolution, customer satisfaction and ticket volume in real time. Custom reports let you tie support metrics to churn and upsell performance.
You can leverage these tools to centralize data from CRM, product analytics and support into unified dashboards that surface the metrics proven to drive revenue. For example, tracking NPS and CSAT in HubSpot Service Hub enables you to resolve detractor issues within 24 hours, cutting churn by up to 15%.
According to Totango, firms that map their customer journey into SuccessBLOCs see a 25% reduction in churn. By aligning your technology stack around these platforms, you move from scattered data to actionable insights, ensuring every customer success interaction contributes directly to your bottom line.
When Should I Start Measuring Customer Success in My Business?
You should start measuring customer success in your business as soon as you onboard your first paying customers and can track key interactions such as onboarding completion, product usage and support requests in a consistent way. For example, companies that begin tracking customer success metrics within the first quarter of launch see up to a 15% reduction in churn and a 10% lift in expansion revenue by year-end.
Capturing data early lets you establish baseline health scores, spot friction points before they escalate, and refine your onboarding and support processes. It also provides the evidence you need to justify investment in customer success resources and aligns your team around proactive retention and growth from day one.
Businesses that delay a formal customer success program until after they reach $5 million in ARR often face churn rates 20% higher than their industry peers, translating to millions in lost recurring revenue. Without early metrics you lack the warning signals that prevent detractors and you miss opportunities to optimize your product-market fit when customer feedback is most actionable. The longer you go without clear data, the harder and more expensive it becomes to reverse poor adoption trends and recover at-risk accounts.
In my opinion, teams that map every key milestone to a metric from day one build repeatable playbooks and scale faster. When you wait, you end up firefighting churn instead of preventing it, and you lose the chance to learn what really drives value for your customers.
Why Is Net Revenue Retention More Important Than Gross Revenue?
Net revenue retention is more important than gross revenue because it shows you how well your existing customer base grows or shrinks over time after accounting for upsells, cross-sells, downgrades and churn. Companies with NRR above 100% not only replace lost revenue but expand it. SaaS leaders average NRR of 110% to 120% and grow 2× faster than peers with similar gross top-line figures.
While gross revenue can look impressive on a scoreboard, it hides whether you are merely acquiring new logos to paper over customer losses. Net revenue retention forces you to focus on what really drives sustainable growth: keeping customers happy, delivering value and unlocking expansion opportunities.
Conclusion: What Should You Focus on First to Drive Real Revenue Gains?
When you think about customer success metrics for revenue the first focus should be on the handful of signals that have the most direct link to your bottom line. Start by measuring your health score to spot at-risk accounts, net revenue retention to capture expansion wins, and time to value to accelerate adoption.
These three metrics give you early warning signs, clear action steps, and a feedback loop that prevents churn while unlocking growth. Once those are firmly in place you can layer in metrics like CSAT, expansion revenue, and churn rate to refine your playbooks without overwhelming your team.
As a business owner you have the option to hire customer success managers who are trained to track these KPIs day to day or to engage outside experts who can strategize and pivot your growth model based on real time insights. You can build an in-house team focused on proactive outreach and routine monitoring, or you can bring in senior CSMs to design high-impact playbooks. Either way you gain the expertise to turn data into action and keep your revenue gains on track.
At GetCSM we provide CSMs who are vetted, certified, and built specifically to drive revenue through customer success metrics. By partnering with our team you get professionals who monitor key KPIs, trigger the right playbooks, and report on results without you hovering over every detail. This allows you to focus on strategic priorities while our CSMs boost retention, expand customer spend, and deliver the predictable cash flow that grows your bottom line.
Book a free consultation to see how our CSMs can boost your net revenue retention.